Bioinformatics Tools for Analyzing DNA Sequencing Data

Written By: Craig Bradley
Oct 10, 2025
GEMINI (2025) The sheer volume and complexity of data generated by modern high-throughput sequencers necessitate sophisticated computational strategies for interpretation, making the proficiency in analyzing sequencing data a core competency for contemporary laboratory professionals. Raw sequencing output, often encompassing billions of short or long reads, requires systematic processing, quality assessment, and mapping against a reference genome before meaningful biological insights can be extracted. The development and implementation of specialized bioinformatics tools for analyzing DNA sequencing data are crucial for transforming raw signals into actionable genetic information, minimizing artifacts and ensuring the robustness and reproducibility of genomic and transcriptomic studies. The first and most critical stage in analyzing sequencing data involves transforming the raw output files into a manageable and trustworthy format. This phase focuses on quality control (QC) and the removal of technical noise that can distort downstream analysis. Raw data is typically stored in the FASTQ format, which contains both the nucleotide sequence and an associated Phred quality score for each base call. Quality Filtering and Trimming: Sequencing reads often contain low-quality bases, particularly at the Trim low-quality bases: Bases falling below a user-defined Phred score threshold (e.g., Filter short reads: Reads that are too short after trimming are discarded, as they cannot be reliably mapped. Remove adapter sequences: Known adapter sequences are identified and excised to prevent false alignments. QC Reporting: Comprehensive QC reporting is necessary before proceeding to alignment. Tools like FastQC generate visual and statistical summaries of the data, highlighting potential issues such as low-quality base distribution, skewed GC content, and over-represented sequences. This early-stage scrutiny is vital because poor quality input data cannot be salvaged by even the most sophisticated downstream methods for analyzing sequencing data. QC Metric Purpose Action if Flagged Per Base Sequence Quality Assesses average quality scores across all bases. Aggressive trimming or library re-preparation. Adapter Content Measures the percentage of reads containing known adapter sequences. Adapter trimming using specialized tools. Sequence Duplication Levels Indicates high duplication rate, potentially from PCR bias. Use tools with Unique Molecular Identifier (UMI) support during analysis. Once the reads are cleaned and validated, the next step in analyzing sequencing data is alignment, where short sequencing reads are computationally mapped to a known reference genome. This process is computationally intensive and relies on highly optimized algorithms designed for speed and accuracy. The choice of alignment tool often depends on the length of the reads and the required sensitivity. Short-Read Aligners (BWA and Bowtie2): For short-read data, the Burrows-Wheeler Aligner (BWA) and Bowtie2 are standard tools. These aligners utilize the Burrows-Wheeler Transform, an efficient text indexing method that allows for rapid mapping of millions of short reads to large reference genomes (e.g., the human genome) while tolerating small mismatches (single nucleotide polymorphisms or short indels). The aligners output the results in the Sequence Alignment Map (SAM) format, which is typically converted to the compressed Binary Alignment Map (BAM) format for efficient storage and manipulation. Long-Read Aligners (Minimap2): For long-read technologies (single-molecule sequencing), specialized aligners like Minimap2 are preferred. These tools are designed to handle the greater length and higher inherent error rates of long reads. They employ specialized indexing and chaining strategies to quickly identify large regions of similarity, a necessary precursor to accurately resolving complex structural variations. Post-Alignment Processing: After alignment, the BAM files require further processing to ensure reliability for downstream variant calling. This includes: Sorting: Arranging reads by their genomic position. Indexing: Creating an index file (BAI) to allow rapid access to reads in specific genomic regions. Duplicate Marking: Identifying and marking reads that are likely PCR artifacts (duplicates) for optional exclusion during variant calling. The resulting processed BAM files are the definitive source material for all subsequent processes involved in analyzing sequencing data, including variant discovery and quantification. The primary goal for many genome-based high-quality-sequencing projects is the discovery of genetic variants, including single nucleotide polymorphisms (SNPs), small insertions/deletions (Indels), and structural variations (SVs). The GATK Toolkit: The Genome Analysis Toolkit (GATK), developed by the Broad Institute, represents the industry standard for robust and accurate variant calling. GATK employs sophisticated probabilistic models and machine learning to distinguish true biological variants from sequencing errors. Its Best Practices workflow includes: Base Quality Score Recalibration (BQSR): Adjusting Phred scores based on observed error patterns in the data. Indel Realignment (historically): Correcting potential misalignments around small Indels. HaplotypeCaller: A sophisticated caller that analyzes read data in local de novo assembly windows to construct potential haplotypes, leading to highly accurate SNP and Indel identification. Variant Call Format (VCF): All identified variants are recorded in the Variant Call Format (VCF), which specifies the chromosome, position, reference allele, alternate allele, quality score, and various genotype-specific metadata. Subsequent steps in analyzing sequencing data involve annotating these VCF entries using databases like dbSNP and ClinVar to predict the functional consequences (e.g., non-synonymous mutation, frameshift) using tools like SnpEff or VEP. Structural Variant (SV) Detection: Detecting large-scale genomic changes (deletions, duplications, translocations) requires specialized tools that analyze discordance in alignment properties. Manta and Delly are designed to examine read pairs, split reads, and read depth to accurately pinpoint SV breakpoints. The integration of long-read data is increasingly preferred for complex SV calling, as a single long read can span and fully resolve an entire SV structure, simplifying the process of analyzing sequencing data related to genomic rearrangement. Analyzing sequencing data derived from RNA sequencing (RNA-Seq) requires a different computational approach focused on quantification and functional context. Instead of aiming for perfect alignment to pinpoint variants, the goal is to accurately measure the abundance of transcribed RNA molecules. Quantification Tools (Salmon and Kallisto): Modern RNA-Seq pipelines have shifted from alignment-based counting (using HTSeq) to faster, more resource-efficient methods based on pseudo-alignment or light-weight mapping, epitomized by Salmon and Kallisto. These tools quantify transcript abundance by statistically assigning reads to transcripts without requiring full base-by-base alignment, significantly accelerating the process of analyzing sequencing data for large experiments. The output is a matrix of Transcripts Per Million (TPM) or Fragments Per Kilobase Million (FPKM) values for each gene or transcript. Differential Expression Analysis: The quantified data is then analyzed using statistical packages like DESeq2 or edgeR to identify genes that are significantly differentially expressed between biological conditions (e.g., treated vs. untreated, disease vs. healthy). These tools employ negative binomial models to handle count data variability, providing rigorous statistical testing for identifying key biological changes in the transcriptome. Functional and Pathway Analysis: The final step in analyzing sequencing data is interpretation. Lists of differentially expressed genes are subjected to Gene Ontology (GO) and Kyoto Encyclopedia of Genes and Genomes (KEGG) pathway enrichment analysis, often using web-based tools or packages like GSEA. This step groups the identified genes into known biological processes, cellular components, or molecular functions, allowing researchers to contextualize the findings and generate testable hypotheses about the underlying biology revealed by the high-quality-sequencing data. The integration of disparate tools into efficient, reproducible pipelines is the hallmark of modern genomics. The bioinformatics landscape has moved toward standardized workflow managers, such as Nextflow and Snakemake, which allow laboratories to define and execute complex, multi-step analysis pipelines in a portable and scalable manner. These managers facilitate the use of containerization technologies (Docker or Singularity), ensuring that the exact software versions and dependencies used for analyzing sequencing data can be consistently deployed across different computing environments, from local servers to cloud platforms. This standardization enhances transparency and dramatically improves the reproducibility of results, which is paramount for all high-quality-sequencing applications in both research and clinical settings. What is the role of the Phred score in analyzing sequencing data?
The Phred quality score is a logarithmically scaled probability measure that estimates the accuracy of a base call; a higher Phred score (e.g., How do specialized aligners handle long-read sequencing data?
Specialized aligners like Minimap2 efficiently handle long-read sequencing data by using probabilistic models and chaining algorithms to quickly locate large-scale similarities, accommodating the longer length and higher inherent error rates characteristic of these reads. Which bioinformatics tool is the standard for high-accuracy variant calling?
The Genome Analysis Toolkit (GATK) is the widely accepted standard for performing highly accurate variant discovery and genotyping in short-read data, utilizing sophisticated models for base quality score recalibration and haplotype phasing to distinguish true biological variants when analyzing sequencing data. What is pseudo-alignment and how does it improve transcriptome analysis?
Pseudo-alignment, used by tools like Salmon and Kallisto, improves transcriptome analysis by quantifying read abundance based on matching subsequences to transcript sequences rather than requiring full, base-by-base alignment, making the process of analyzing sequencing data for RNA-Seq significantly faster and more resource-efficient. This article was created with the assistance of Generative AI and has undergone editorial review before publishing.
Initial Processing and Quality Control for Analyzing Sequencing Data
Alignment and Mapping: Core Bioinformatics Tools for Analyzing Sequencing Data
Variant Discovery and Genotyping Using Reference-Based Analysis
Analyzing Sequencing Data for Transcriptomics and Functional Interpretation
Optimizing Bioinformatics Workflows for Efficient Sequencing Data Analysis
Frequently Asked Questions (FAQ)

Feb 26, 2026
Product News
Waters Launches Microflow LC Columns with MaxPeak Premier Technology for Higher Sensitivity and Lower Resource Consumption
The product launch reflects continued investment in chromatographic chemistries that address real-world bottlenecks in method development and routine analysis

Feb 19, 2026
Technical Insight
Implementing Hydrogen Generators for Clean Lab Gas Supply: Safety and Benefits
Transitioning to on-site gas production streamlines analytical workflows, eliminates hazardous cylinder storage, and supports facility sustainability.
Feb 19, 2026
Technical Insight
Circular Economy in Laboratory Equipment: How to Adopt Repair, Reuse, and Refurbishment Strategies
Adopting a circular economy for laboratory equipment minimizes environmental impact while maximizing instrument lifespan and optimizing laboratory budgets.
Feb 12, 2026
Product News
$5M+ in GMP Biopharma Manufacturing & QC Equipment Heads to Online Auction
A Southern California GMP manufacturing and clinical-stage QC laboratory is liquidating new and late-model equipment and unused inventory in an online auction opening February 11, 2026

Feb 12, 2026
Product News
2026 SLAS: Inspiration Catalyzing Discovery
A LabX look at the annual conference and exhibition, a key forum for networking, collaboration, and advancement of new technologies

Feb 11, 2026
Product News
Angstrom Scientific Named U.S. Distributor for Radalytica’s RadalyX Robotic X-ray and CT System
Angstrom Scientific, known for representing microscopy and materials analysis technologies across North America, adds Radalytica’s robotic X-ray and CT platform to its portfolio of analytical and imaging solutions.

Feb 10, 2026
Technical Insight
Eco-Friendly Refrigeration: Evaluating Natural Refrigerants and Low-GWP Cooling Systems
This guide explains the operational and environmental benefits of adopting natural refrigerants and low-GWP cooling systems in laboratory settings

Feb 10, 2026
Technical Insight
The Ultimate Guide to Sustainability in Laboratory Equipment and Operations
A comprehensive analysis of sustainable laboratory practices, focusing on energy-efficient equipment, waste management, and digital workflows

Jan 12, 2026
Technical Insight
The Best Polarimeters of 2026
A comprehensive guide to the top-rated polarimeters of 2026, featuring high-speed, high-precision, and budget-friendly models for every laboratory application.
Jan 09, 2026
Product News
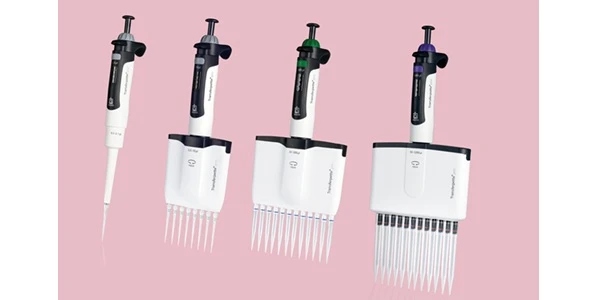
BRANDTECH Scientific Introduces the Transferpette® pro Micropipette: A New Twist on Comfort and Control
The latest addition to its trusted line of precision liquid handling instruments, engineered for comfort, control, and repeatable accuracy.