Fast and Easy Cannabis Potency Testing Using an Entry Level Agilent 1260 Infinity LC

Written By: Damon Anderson, PhD
Feb 14, 2018
Jason Strull M.S., Jeff Angermann, PhD., Bevan Meade, M.S., 374 Labs
Terry Potter, Quantum Analytics
Abstract
This Application Note details a fast and simple analytical approach for quantitation of 9 Cannabinoids of interest using an Agilent 1260 Infinity configured as an ‘entry level’ instrument. Results obtained from actual cannabis samples were cross-validated on a separate LC/MS/MS system using UHPLC separation techniques. The obtained results demonstrate excellent concordance between the two systems and illustrate the ability of the 1260 to generate comparably accurate results to more expensive and complicated systems.
Introduction
In the United States, the increasing acceptance of medical and recreational cannabis at the state level has created a need for accurate, precise and efficient analysis of cannabinoids in marijuana flower, extracts, and formulated products. At the same time, the lack of Federal recognition of marijuana for either recreational or medical purposes has effectively decentralized the development of analytical approaches for determination of cannabinoid content in these products, thereby creating a significant need for development of reliable and robust analytical protocols.
In the cannabis plant, the two major cannabinoids of interest, ?-9-Tetrahydrocannabinol (THC) and Cannabidiol (CBD) are primarily found in their acid forms (THCA and CBDA respectively; Figure 1). THCA and CBDA are commonly decarboxylated to their neutral forms via heating or combustion during the process of smoking (for either raw flower or various types of extracts), or prior to ingestion of formulated edible products.
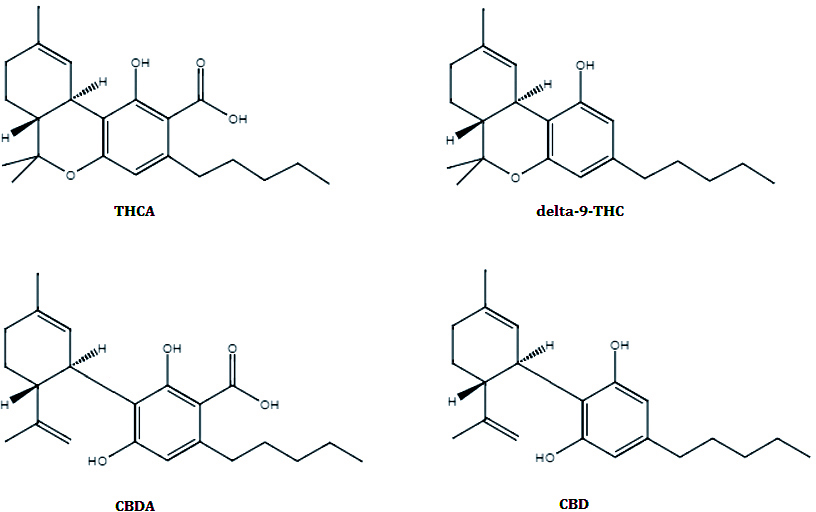
Figure 1: Primary Cannabinoids of interest in Cannabis flower and extracts.
For many decades, this has been taken for granted as a desirable process for ‘recreational’ use of cannabis, since THCA lacks the psychoactive properties of its decarboxylated form. As the societal acceptance of cannabis for both recreational and medicinal use increases, and the biochemical properties of the plant are explored in greater detail, there has been an emergent interest in the pharmacological properties of the acidic forms of the cannabinoids. The relevance of this paradigm shift to cannabis analytical chemistry is explained below.
Gas Chromatography (GC) has historically been the default analytical method choice for cannabinoid determination due to widespread availability and low cost, but most cannabis analytical chemists now prefer High Pressure Liquid Chromatography / Ultra High Pressure Liquid Chromatography (HPLC/UHPLC) due to an increased desire to report the sum of the acid and neutral forms of the major cannabinoids during potency quantitation. This reporting scheme is desirable for numerous reasons, including (1) Increased awareness of the unique biological significance of the acid forms of the major cannabinoids (Ref 1 & 2) and (2) uncertainty regarding the reproducibility / extent of decarboxylation in the injection port of the gas chromatograph (Ref 3), which may lead to accuracy and precision issues when reporting total cannabinoids by GC.
An intensive focus on selective breeding and cultivation of cannabis over the last four decades has resulted in unprecedented production of desirable secondary metabolites; the High Times ‘Strongest Strains on Earth” competition generally considered a reliable showcase of contemporary cannabinoid titration values- details peak flower values of 21 weight percent CBD; 32 weight percent THC during the 2016 competition (Ref 4).
Liquid chromatography with multiple wavelength or continuous array ultraviolet-visible (UV-VIS) detection is a robust, capable, and economical choice for routine cannabinoid analysis in a variety of matrices. A standard consortium of 5-9 cannabinoids typically detected and quantified in cannabis flower and related products is easily characterized via retention time and spectral matching for peaks of interest with a binary solvent gradient method of 5-40 minutes for HPLC and 5-10 minutes for UHPLC, with sensitivities approaching 0.05 weight percent for the major cannabinoids.
This application note details a quick and thorough sample preparation and instrument method for the quantification of cannabinoids of interest in marijuana flower, utilizing an affordable Agilent 1260 system coupled with UV detection.
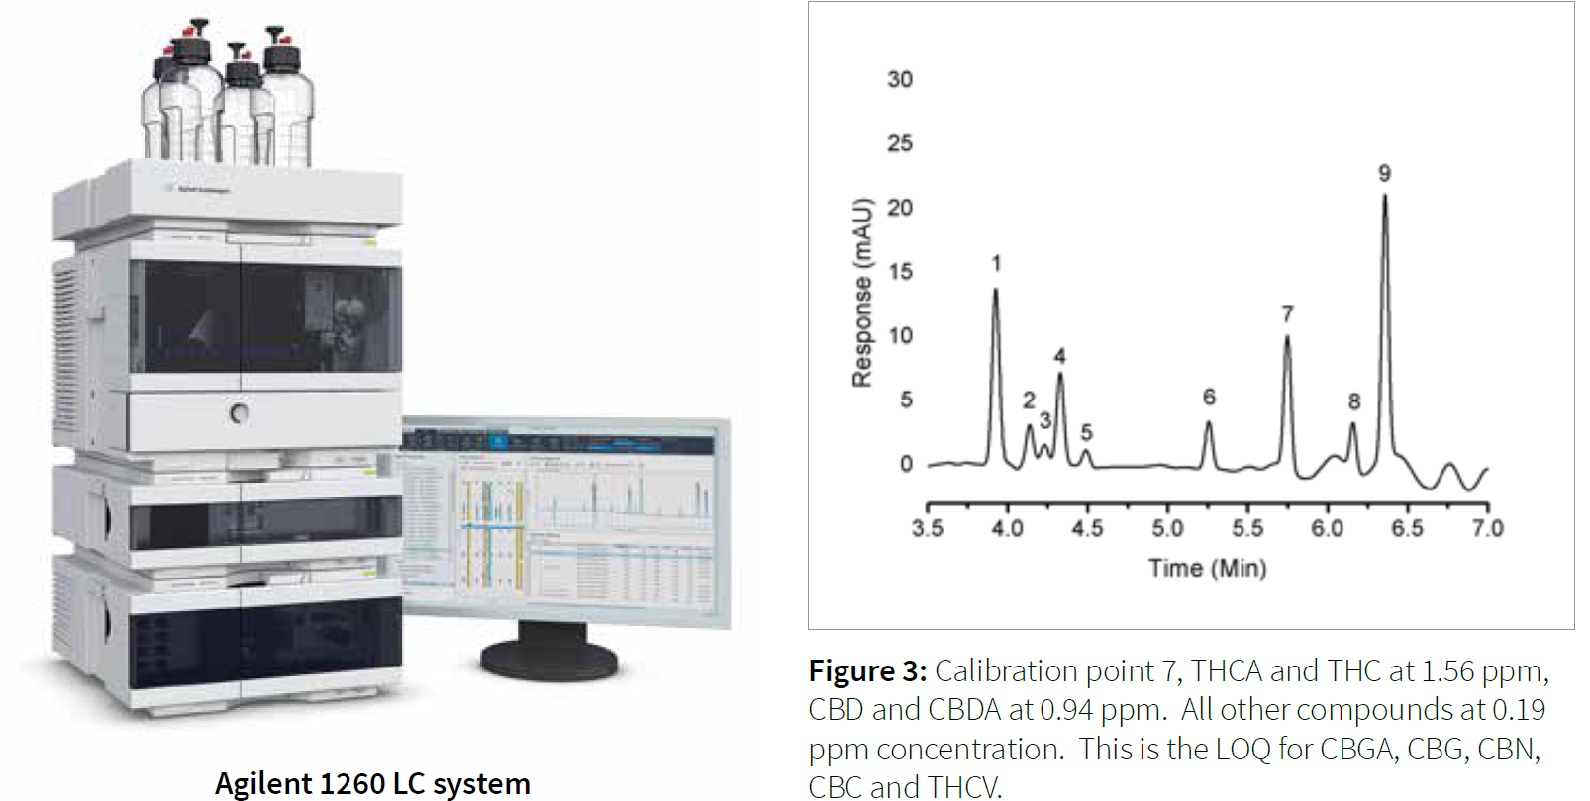
Experimental Instrumentation:
An Agilent 1260 Infinity LC System, configured as follows, was used:
- Agilent 1260 Infinity Quaternary Pump (G1311B)
- Agilent 1260 Inifinty Standard Autosampler (G1329B)
- Agilent 1290 Infinity Autosampler Thermostat (G1330B)
- Agilent 1260 Infinity Thermostatted Column Compartment (G1316A)
- Agilent 1260 Infinity Variable Wavelength Detector (G1314F)
Standards and Standard Solutions:
All standards were purchased from Cerilliant (Round Rock, Texas, USA), at 1 mg /mL (1000 ppm) concentration. The following standards were used:
- ?9-Tetrahydrocannibinol (?9 THC, Cerilliant part number T-005)
- ?9-Tetrahydrocannibinolic Acid (?9 THCA, Cerilliant part number T-093)
- Cannabidiol (CBD, Cerilliant part number C-045)
- Cannabidiolic Acid (CBDA, Cerilliant part number C-144)
- Cannabigerolic Acid (CBGA, Cerilliant part number C-142)
- Cannabigerol (CBG, Cerilliant part number C-141)
- Cannabichromene (CBC, Cerilliant Part number C-143)
- Tetrahydrocannabivarian (THCV, Cerilliant part number T-094)
- Cannabinol (CBN, Cerillaint part number C-046)
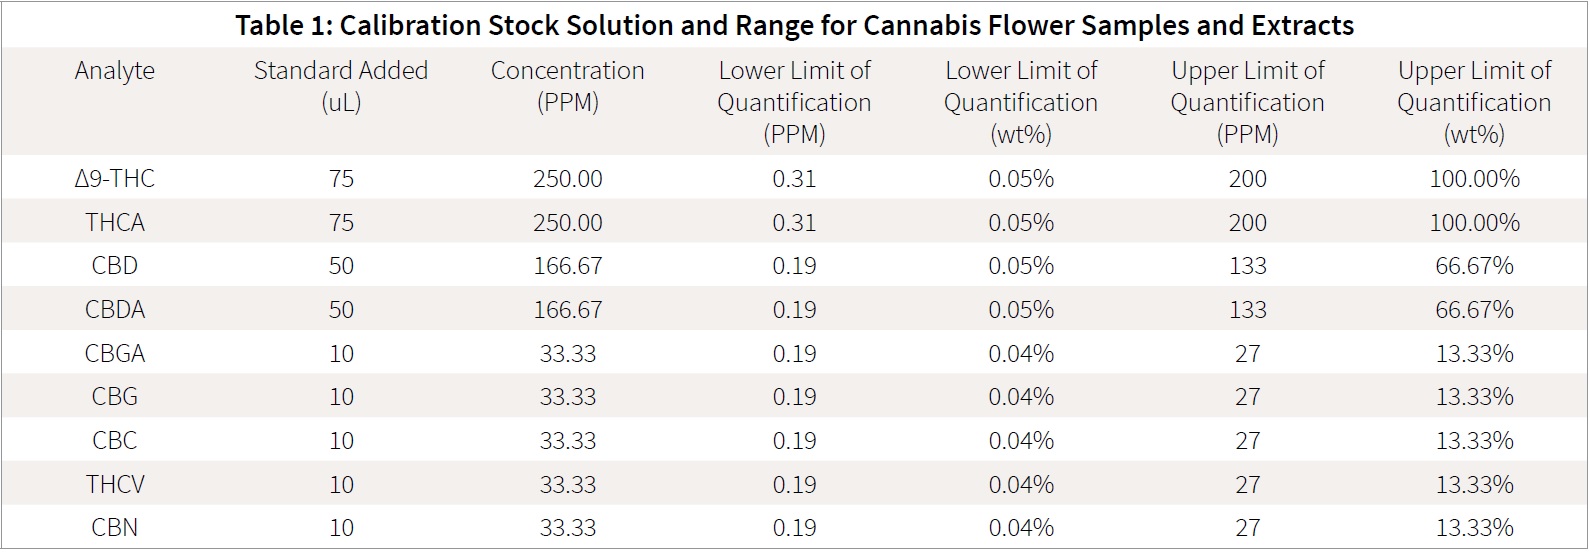
Stock solutions were prepared in methanol for calibration curves. Standards were mixed at different concentrations to create calibration curves with linear ranges that would reflect expected marijuana flower and extract concentrations for the analytes. Table 1 details the procedure for calibration curve stock solution and limits of detection for flower and extract samples. Both sample types, extracts and flower samples, are able to utilize the same curve. 374 Labs has found that the majority of samples fit with in the stated linear range. For samples exceeding the linear range, a quick dilution of the prepared sample can easily bring the final extract concentration back into the range of the calibration curve.
The eight-point calibration curve was prepared via serial dilution as shown in Table 2. Samples were made in ultra-recovery style vials. This method of preparation is necessary as the cannabinoid standards are commonly only available in concentration less than 1mg /mL (1000 ppm), due to their illicit status. The described preparation is desirable in that it does not involve “drying down” the calibration stock solution to further concentrate the standard, with subsequent enhanced risk of decarboxylation or loss of sensitive cannabinoids.
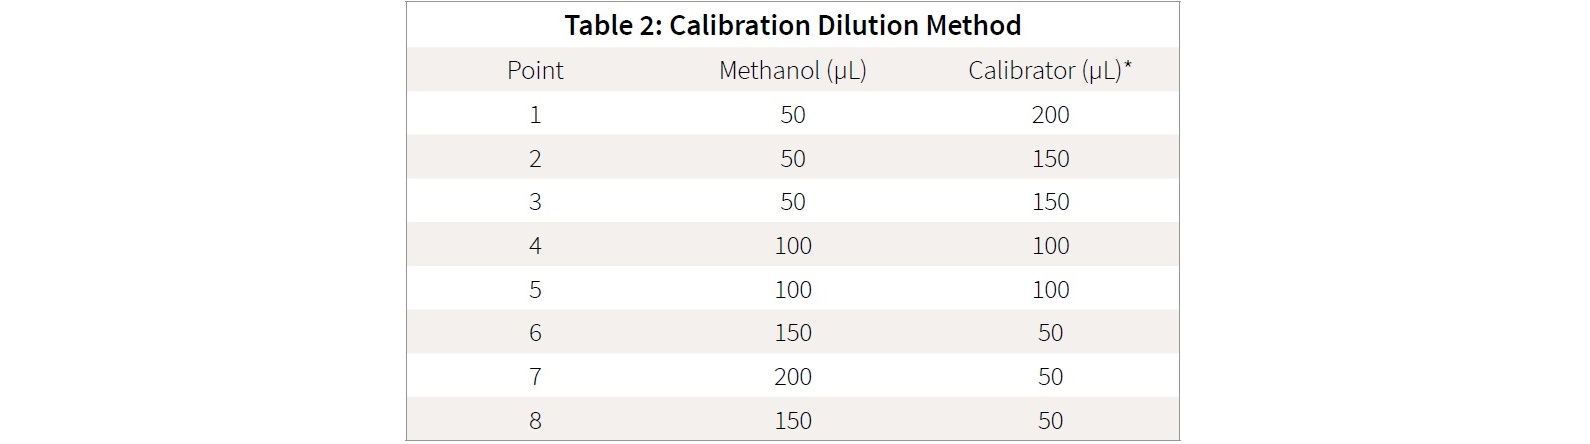
Serial dilution utilizes the previous calibration point to make the subsequent calibration point. For the first point (‘top level’ standard), the calibration stock solution is used and mixed with methanol.
Sample Preparation:
Cannabis flower and extract samples were analyzed from legal medical cultivators and producers in Nevada. Flower samples were ground in a blade mill prior to analysis. 100 mg of ground flower was placed in a 15 mL glass centrifuge tube. 10 mL of HPLC grade ethanol was added to the tube and the sample was vortexed for 30 seconds. After vortexing, the sample was placed in an ultrasonic bath for 30 minutes. Once removed from the bath, the sample was centrifuged for 5 minutes at 5,000 rpm. Once removed from the centrifuge 50 uL of the ethanol extract is diluted with 950 uL of methanol in a standard HPLC vial.
The sample is then injected on the HPLC. For cannabis extract samples, the sample preparation is identical, only the amount of starting material used was 40 mg. Extract samples were homogenized as follows: Supercritical Carbon Dioxide extracts were placed in a beaker with stir bar and heated with mixing for 15 minutes at 40 degrees C. Butane Hash Oil samples were found to best homogenized by grinding the BHO sample (‘shatter’) with a ceramic mortar and pestle under liquid nitrogen.
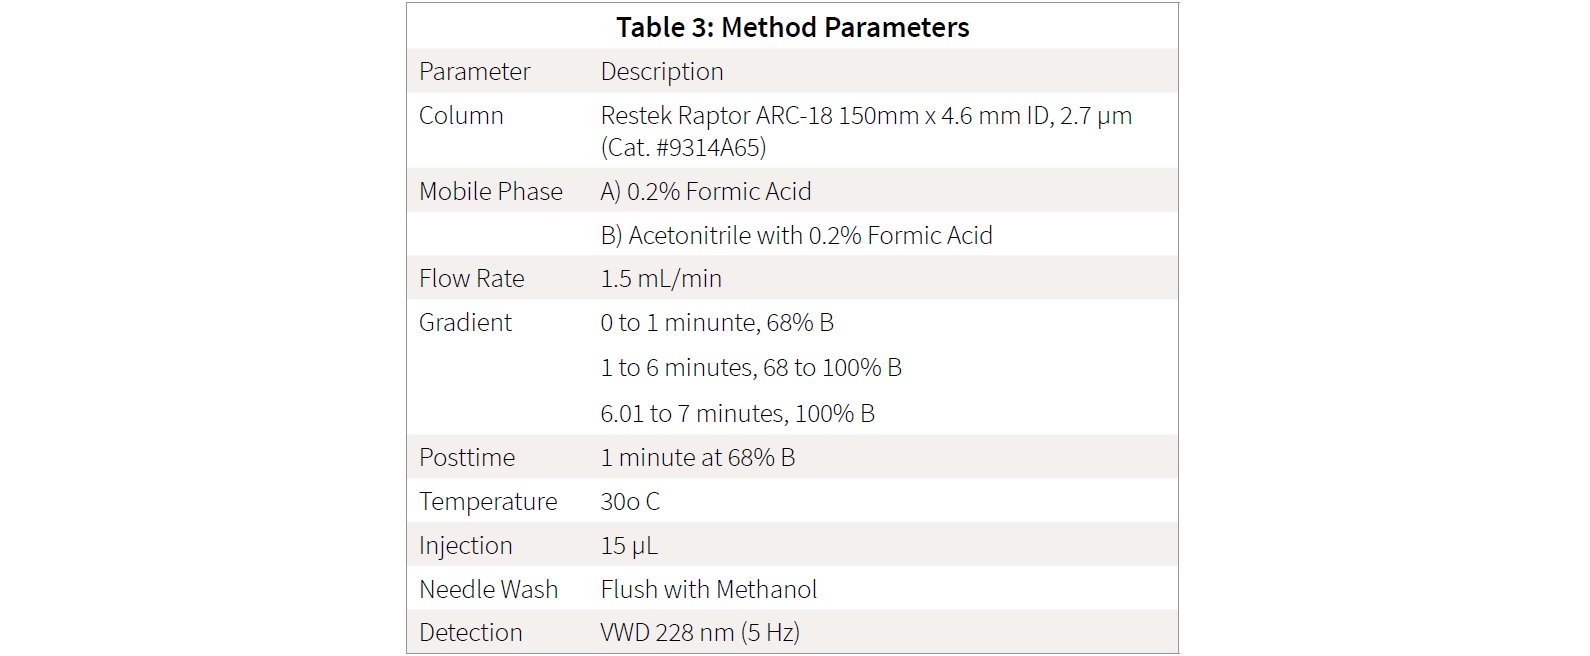
Method Parameters Table for Instrument:
Results and Discussion
The aim of this work was to establish a quick and robust sample preparation and analysis method amenable to routine performance by both trained chemists in laboratory settings and cannabis cultivators with little to no analytical experience. The primary objective was to create a sample preparation and analysis protocol that is simple, cost effective, reproducible, and flexible- such that a single method would enable analysis of both cannabis flowers and extracts.
The method was validated based on methodology from the Clinical Laboratory Improvement Amendments (CLIA), developed by the Centers for Medicare and Medicaid Services (CMS). CMS regulates all laboratory testing (excluding research) performed on humans and human specimens in the United States. In total, CLIA covers over 250,000 laboratories in the United States and is the most recognized program dealing with laboratory operations and procedures (Ref 5).
The major objective of the CLIA program is to safeguard laboratory testing to make certain accurate results are reported. The purpose of “method validation” of Laboratory Developed Tests is to create and implement a method-specific quality assurance protocol, which ensures that reported results are reliable (Ref 6). The process of validation is broken down into the following components and were applied to this developed method:
1. Accuracy: Comparison between other methods
2. Precision: Inter/intra day testing
3. Reportable linear range: Performance of instrument/sample prep calibration curves
4. Extraction efficiency: Recovery of selected analytes
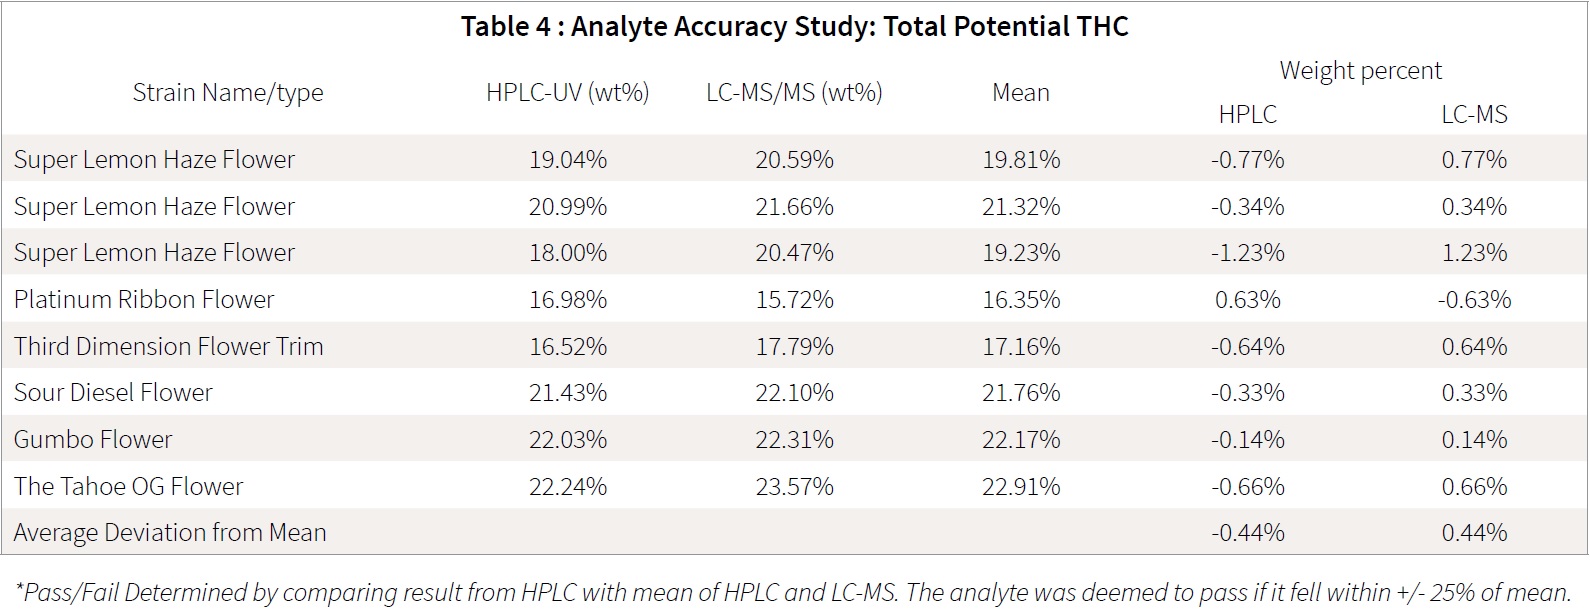
Accuracy:
Accuracy is the concept that the result obtained from the developed laboratory testing method is in agreement with the true result. Method accuracy, for any given test material, can be proven and certified by comparing results between the newly developed laboratory testing method and the “reference” method. Additionally, method accuracy can be established by utilizing the newly developed laboratory testing method to analyze certified reference material.
The problem with this approach to cannabis samples is the lack of validated, published methods for cannabinoid concentration, and lack of certified matrix matched reference material. Because of this, the method was validated against a method previously developed for LC-MS/MS.
This LC-MS/MS method was validated using QC reference material and through comparison with other cannabinoid testing laboratories in Nevada. The LC-MS/MS underwent the same above method validation protocol and was used as a reference test, to ensure the samples would result in similar values regardless of the choice of sample preparation or analytical method employed (typically HPLC-UV or LC-MS/MS.)
Twenty samples were used for the accuracy study; 10 cannabis flower/trim samples and 10 cannabis extract samples were prepared by different sample preparations for both HPLC and LC-MS/MS. Samples were processed the same day and run overnight on the respective HPLC and LC-MS/MS instruments. Results obtained showed good analytical agreement, with all results within 25% of each other. For instance, if a given sample has 20% analyte content, analyzed values should fall within the range of 16-24%.
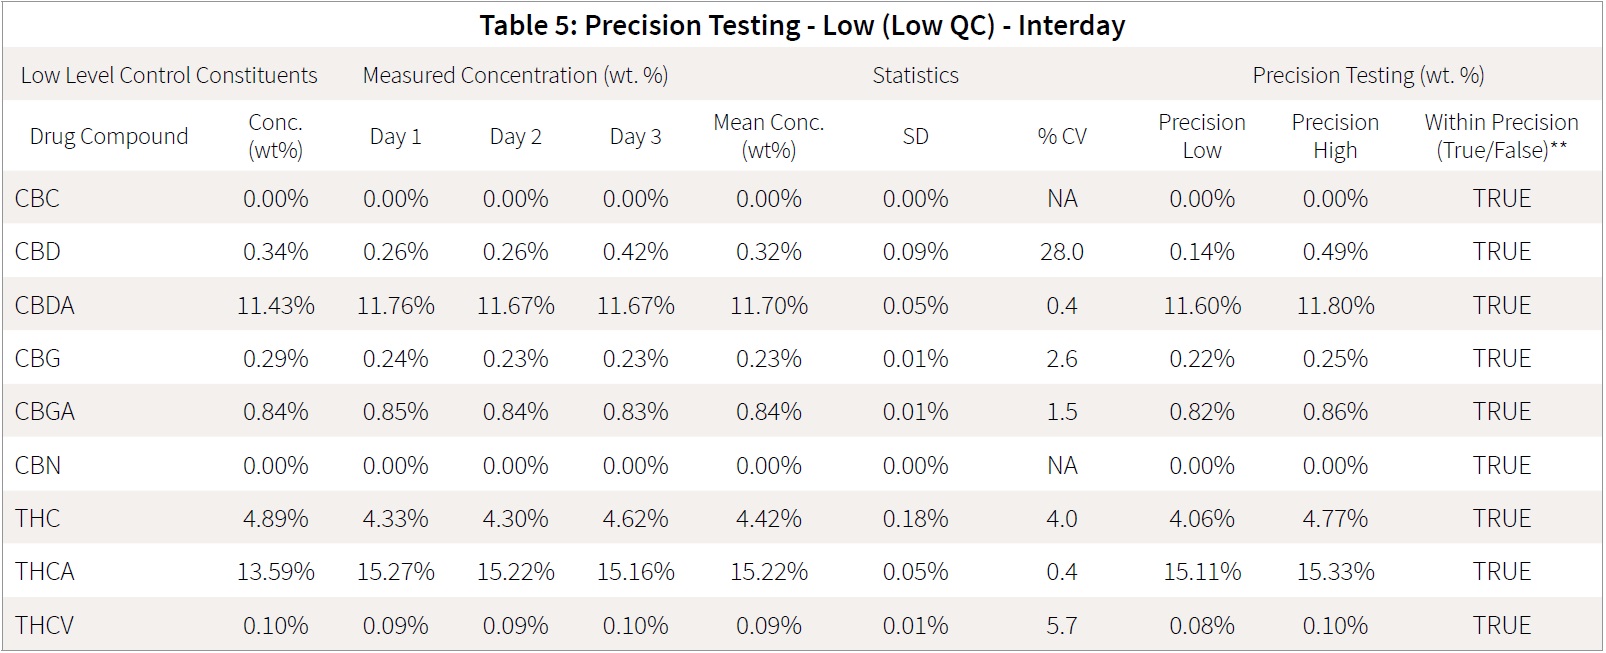
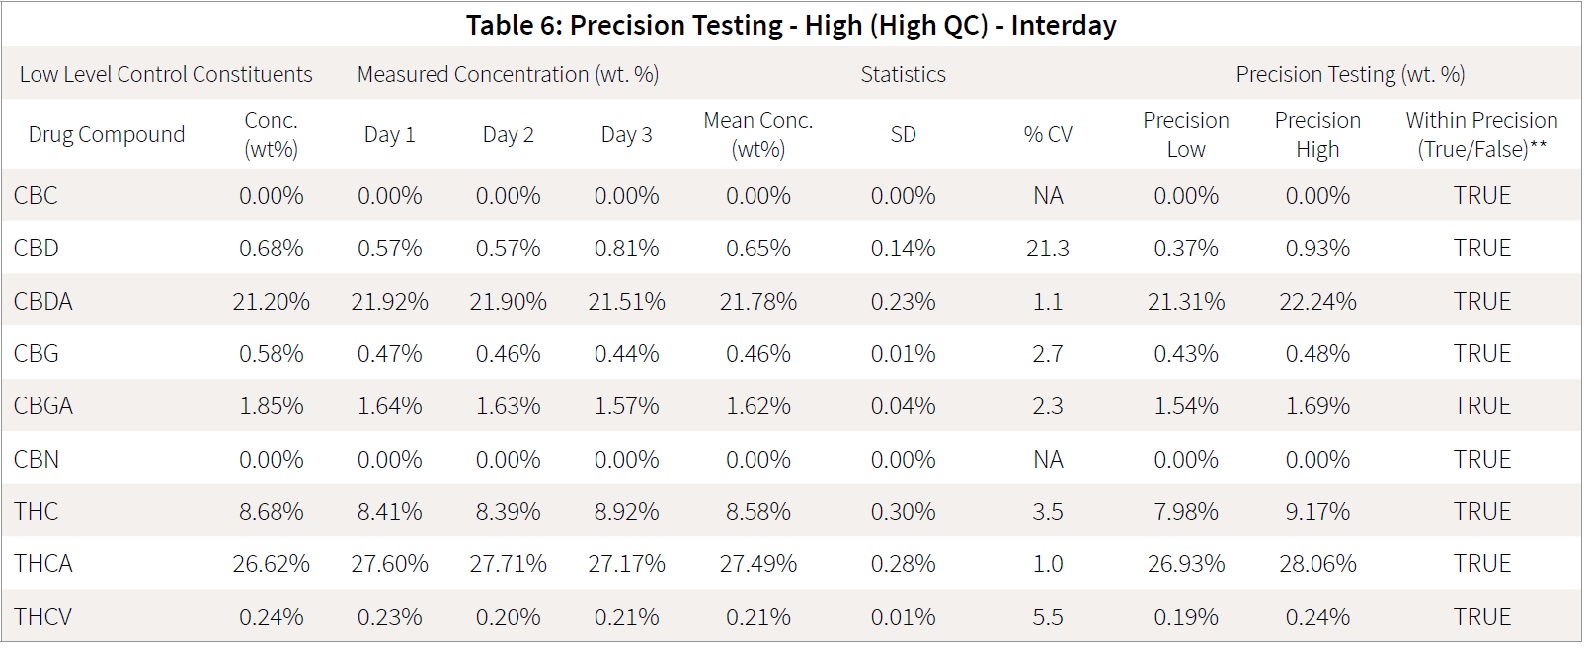
Precision:
The Precision (also known as ‘reproducibility’) of a laboratory testing method is the extent to which the method ensures accuracy (a) within a run, (b) between runs and (c) between days. This is commonly referred as “intra/inter-day testing”. For this method Quality Control material, prepared previously for laboratory QC policy, was utilized.
This laboratory quality control material was made by combining cannabis flowers and extracts to produce a sample representative of the normal cannabinoid range anticipated for cannabis samples. The QC material is run every day, and samples are processed and analyzed to ensure that both sample preparation and analysis are performed accurately. These samples have been analyzed by both HPLC and LC-MS/MS, and the concentrations of the analytes are well-defined within the laboratory. This material was prepared and analyzed as sets of 5 intra-day tests of the same sample, QC-Low and QC-High, and analyses were performed over an inter-day period of 3 days.
Accuracy was accessed daily on each of the samples based on the mean QC value determined previously by the laboratory as mean value ± 25%. All samples fell within the required accuracy range. The mean response for each of the analytes on each day was determined in order to statistically assess whether all the analytes fell within the precision requirement of mean value ± 25%. The mean for each day were compared for precision of the interday runs.
All of the interday testing was within the range of mean ± 2 standard deviations testing. Tables 5 and 6 detail the statistical interday precision study. Intraday tables are attached as supplementary documents.
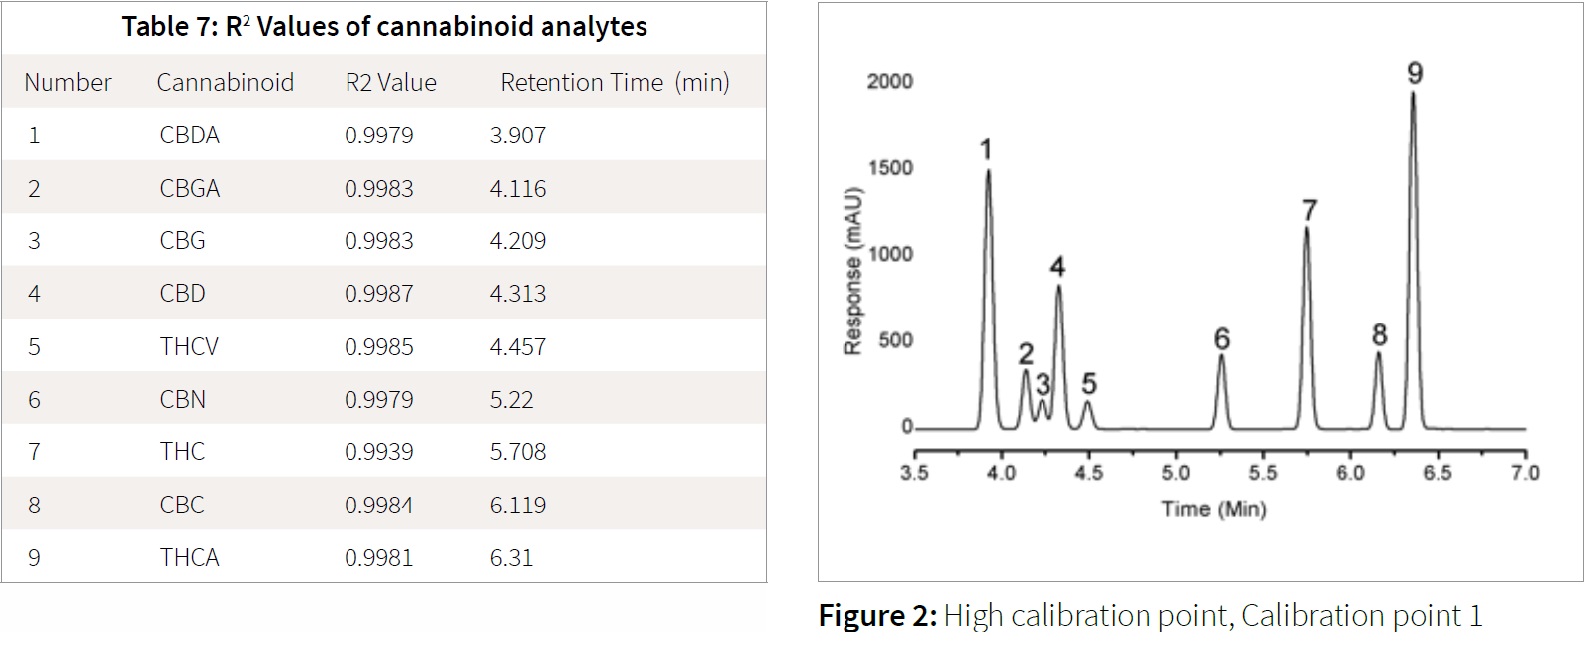
Reportable Range:
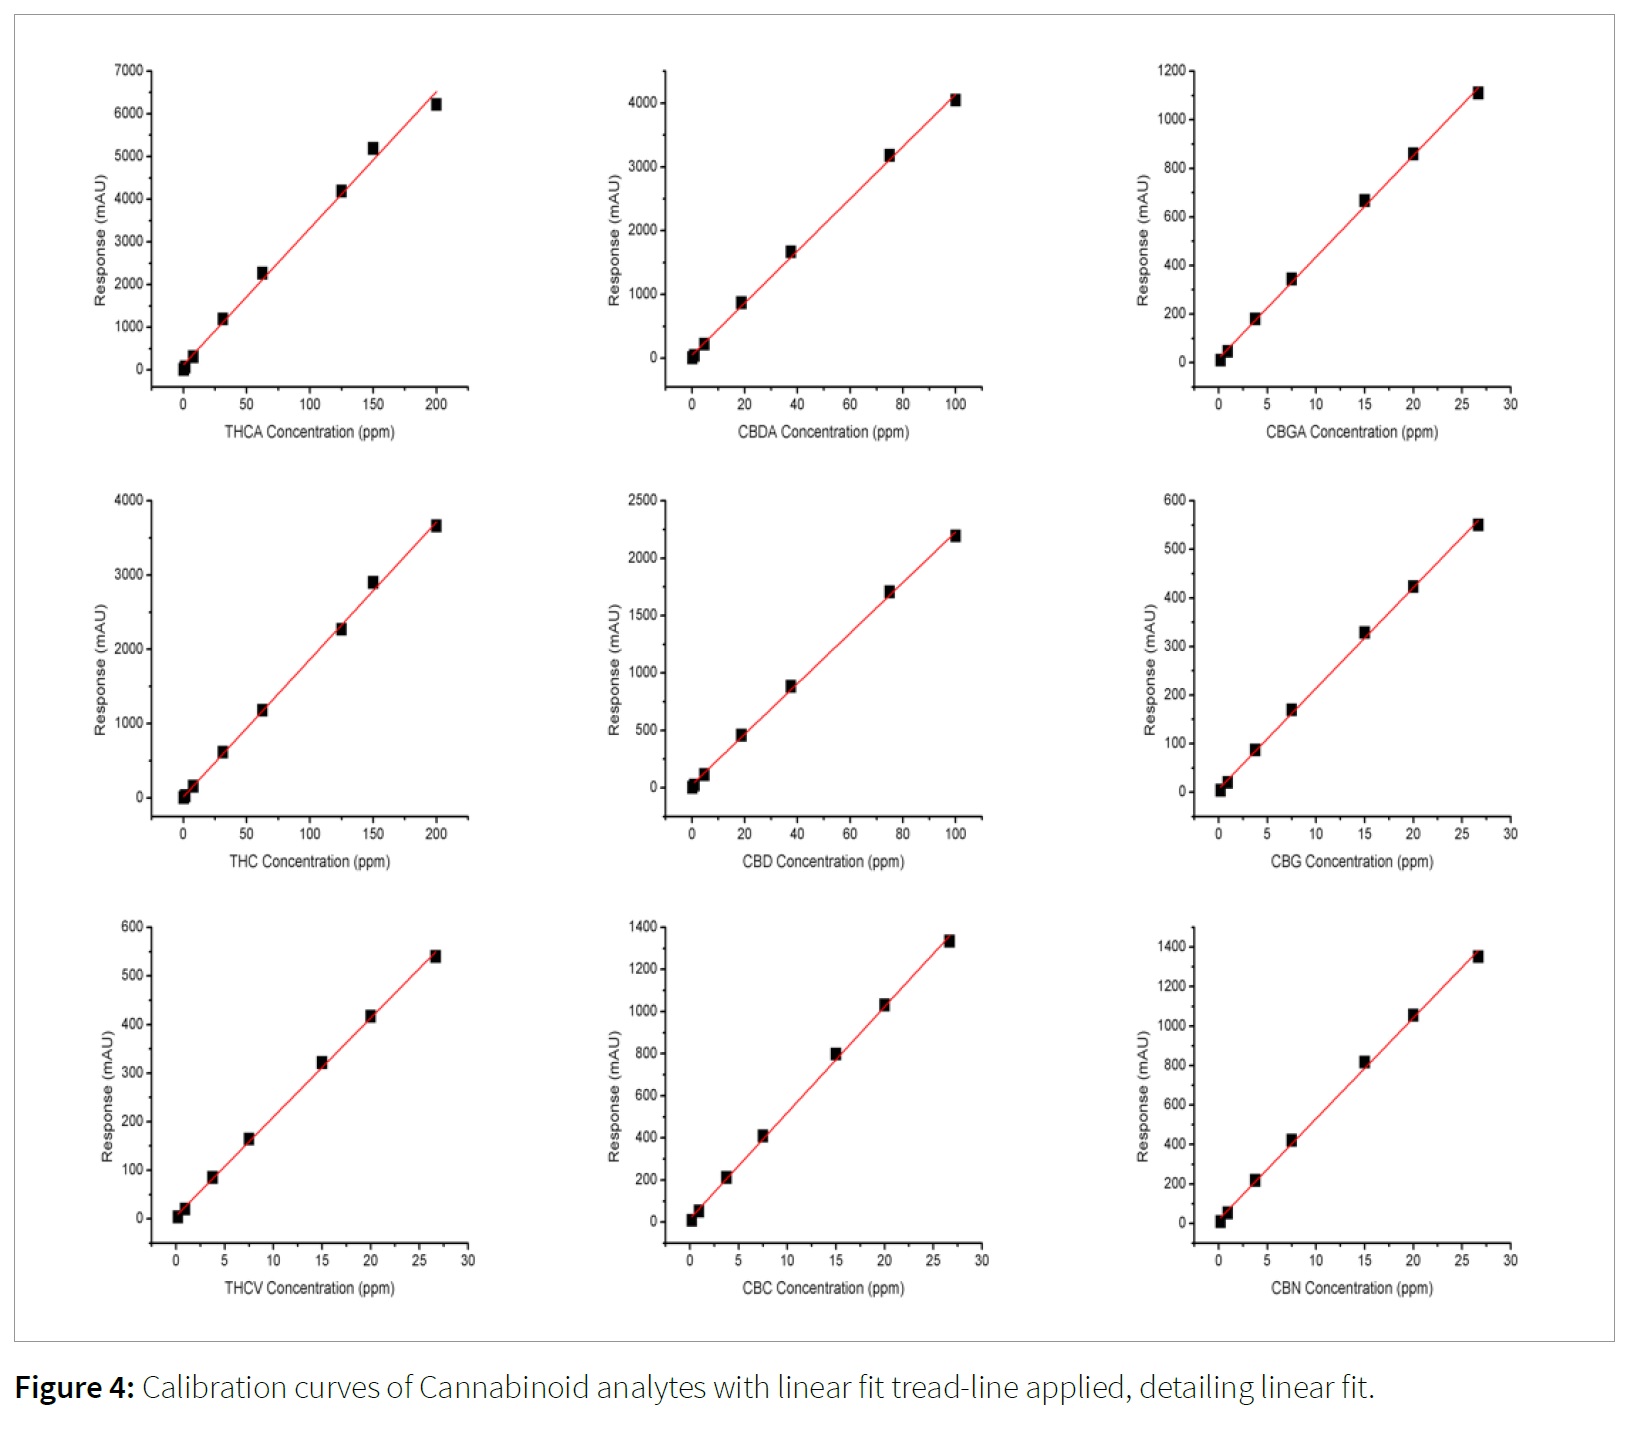
Reportable range is defined as the range in which the instrument response to a range of concentrations remains linear. This is shown generally by a graph detailing concentration on the x-axis and either absorbance, area under curve (AUC), or response on the y-axis. This graph is known as a calibration curve. The linearity is judged by the square of the coefficient of determination, also known as the R2 value. The R2 value is the statistical determination of the linear fit of the calibration curve in how well the regression model fits the actual data points. The general standard for analytical results are R2 values greater than 0.98. R2 values less than 0.98 can result in inaccurate data; the best-fit possible will result in an R2 value of 1.
The cannabinoids linear range was shown to possess excellent linear fit, with all R2 values greater than 0.99. The R2 values, example calibration chromatograms and calibration curves are shown in Figures 2, 3 and 4, and Table 7.
The presented method allows the utilization of a single analyte calibration curve to quantitate both cannabis extracts and flower samples. This enables the end user to quickly build a calibration curve and prepare samples using near identical sample preparation methods. This method creates simple workflow and the ability to easily process both cannabis flower and extract samples without added complexities. The end user can adjust the starting sample mass (40 mg for cannabis extracts and 100 mg for cannabis flower samples), to change the weight percent limit of quantification, while still maintaining the same “on-column” ppm concentrations. This creates the following limits of quantification as shown in Table 8.
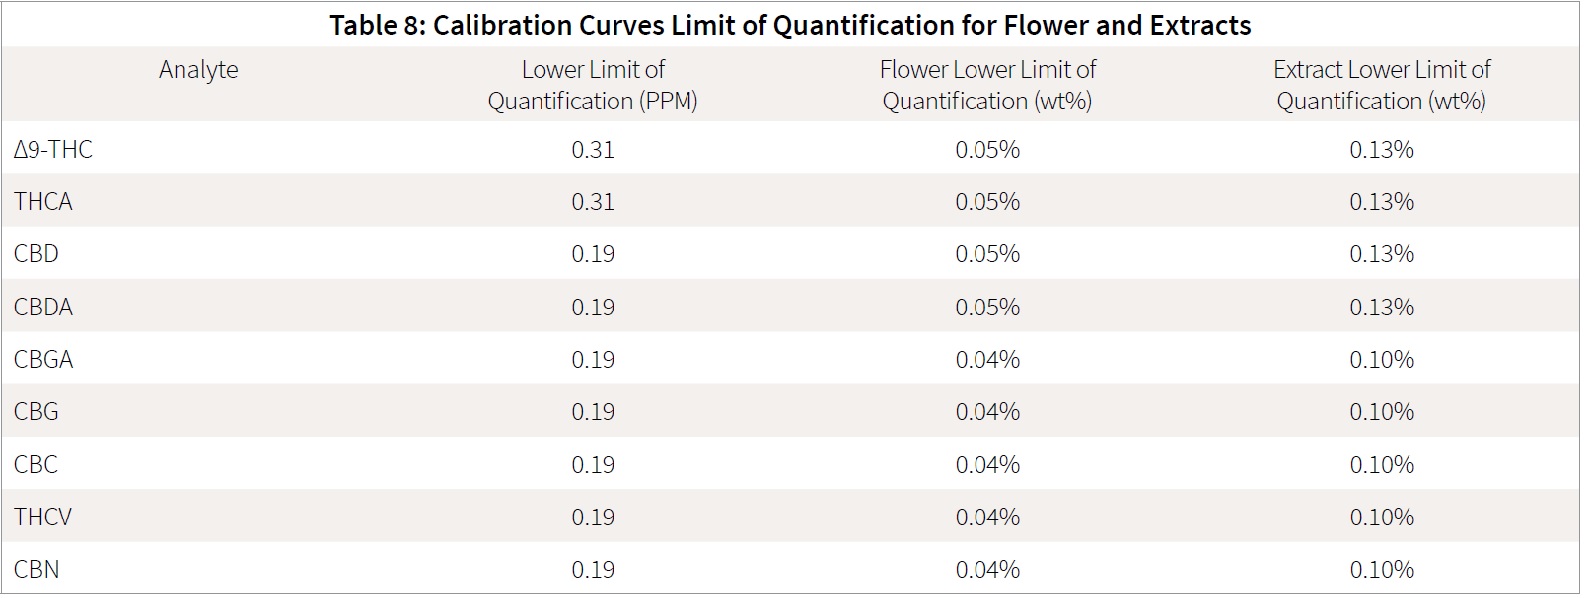
The limit of quantification (LOQ) is based on the calibration curves above as the lowest calibration point included in the calibration curve. The measure of sensitivity is applied to ensure the points are not only present, but also above the noise range. The measure of signal to noise is applied to ensure that all the LOQ points have a signal to noise greater than 10 while at the same time falling within
the linear region of the calibration curve.
Extraction Efficiency:
Assessment of extraction efficiency is necessary to ensure that the developed method is able to extract all of the analytes of interest from a given sample. Cannabis extracts are easily dissolved into ethanol. However, cannabis flower can cause inefficiencies in extraction due to the solid matrix and the inability of ethanol to completely dissolve the plant material. Additionally, cannabinoids are typically bound within the plants glandular trichomes and require a solvent-based extraction methodology to completely remove them from the matrix (Ref 7).
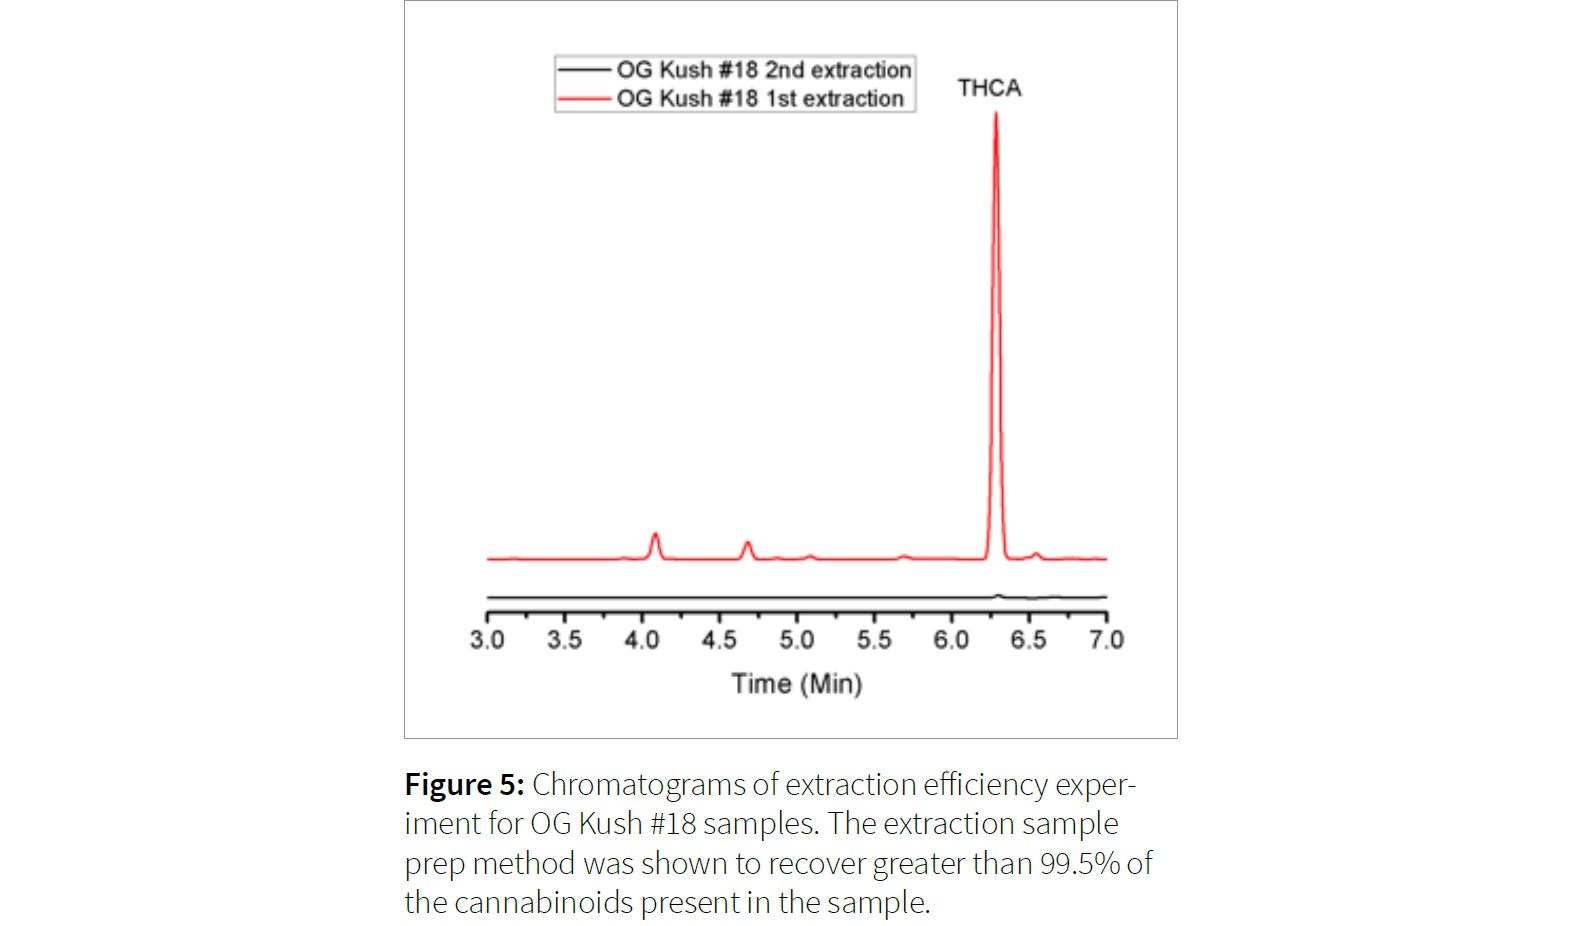
As a way to assess sample recovery of the method, samples were extracted in duplicate using the presented method sample preparation. After the samples were extracted, the plant material was vacuum filtered and washed with ultrapure water to remove remaining ethanol. The filter paper containing the extracted plant material was placed in a drying oven overnight at 40 degrees C and the plant material was weighed out, prepared as previously described, and injected on the HPLC.
The flower sample OG Kush #18 was found to have the highest concentration of the samples prepared for the extraction study at 25.4 weight percent THCA (126.9 ppm). After filtering and drying the replicate plant material, the re-extraction of this plant material resulted in a peak near the detection limit at 0.4 ppm, the equivalent of 0.08 weight percent THCA.
Similar results were observed for other flower samples, and lower concentration THCA flower was shown to have an unobservable THCA peak. The extraction efficiency for the method presented resulted in an extraction efficiency of over 99.5%. The results of the double extraction on the OG Kush #18 are shown in Figure 5.
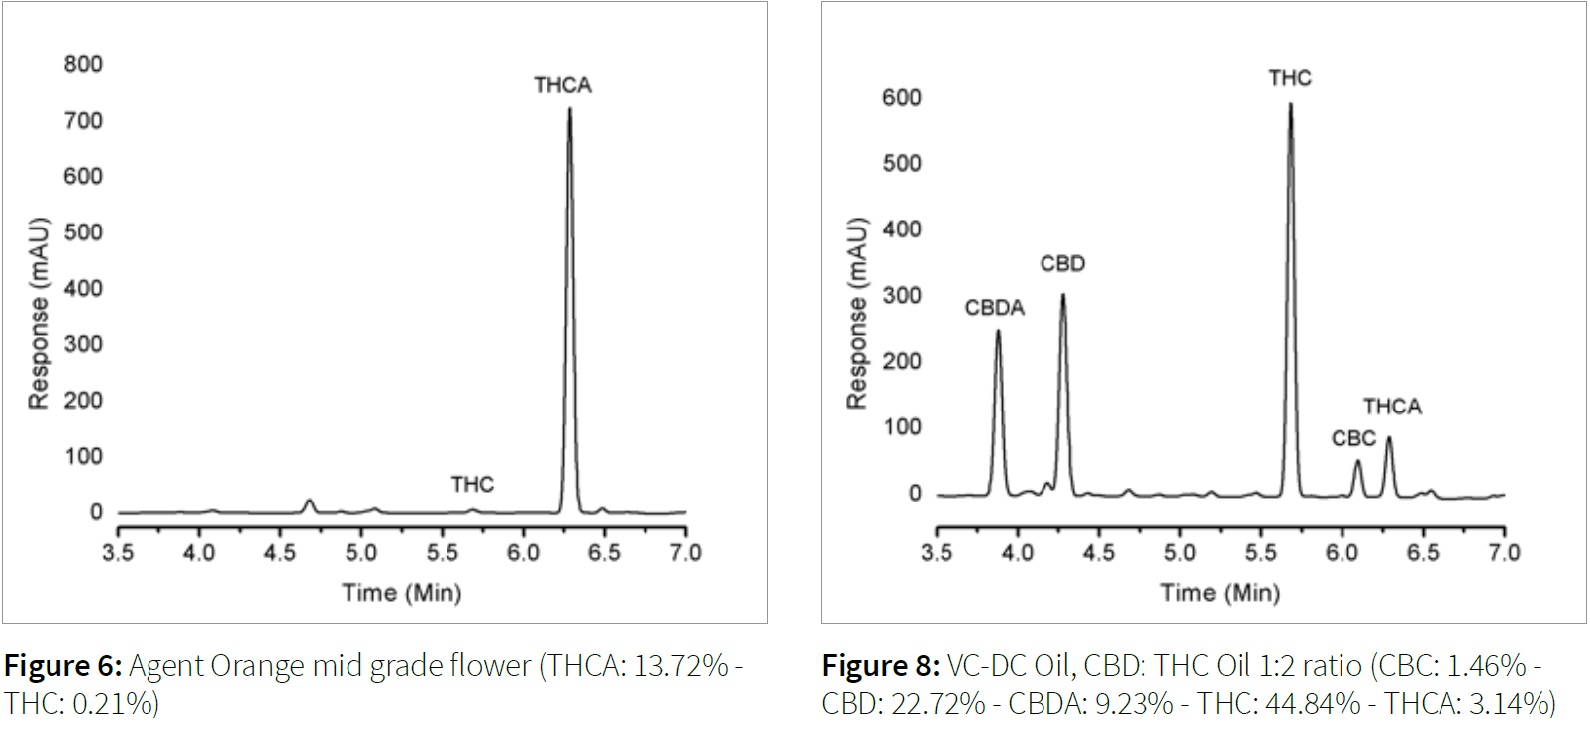
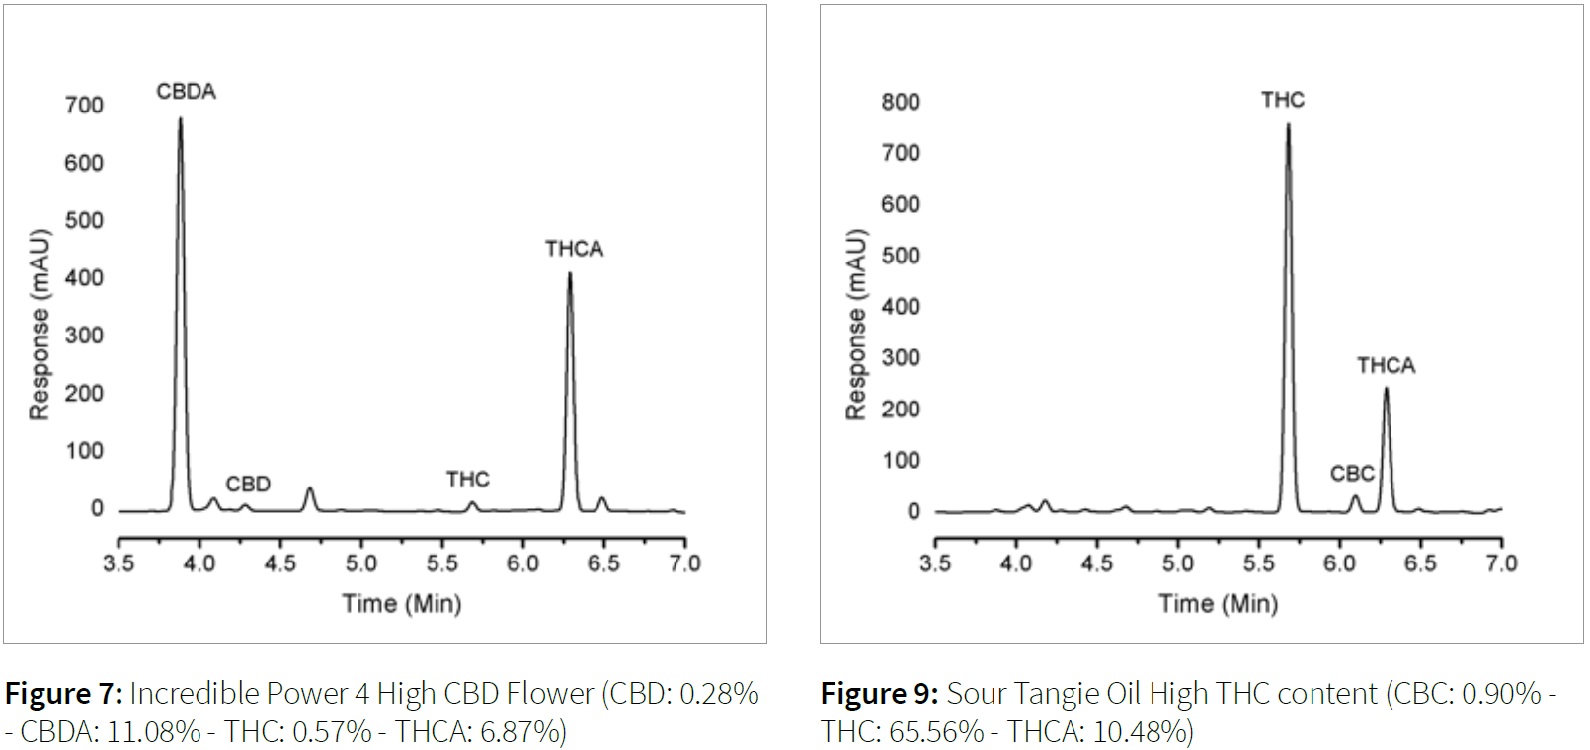
The following figures (6-9) detail the sample preparation and chromatography achieved for various types of cannabis samples for the aforementioned method.
Conclusion
The Agilent 1260 Infinity LC system is a robust, moderately priced instrument ideally suited to the task of speciating and quantitating cannabinoids isolated from cannabis flower and solvent / CO2 extracts. This application note demonstrates the ability of the Agilent 1260 system to facilitate reliable, high-throughput quantitation of cannabinoids with accuracy and system stability rivaling LC/MS/MS systems, yet with much lower consumable and operating costs. The superior linear range of the instrument brings down per-sample costs and increases determination accuracy by obviating extensive and error-prone sample dilution steps prior to instrumental analysis.
References
- Rock EM, Limebeer CL, Navaratnam R, Sticht MA, Bonner N, Engeland K, Downey R, Morris H, Jackson M, Parker LA. A comparison of cannabidiolic acid with other treatments for anticipatory nausea using a rat model of contextually elicited conditioned gaping. Psychopharmacology (2014) 231:3207–3215.
- Takeda S, Himeno T, Kakizoe K, Okazaki H, Okada T, Watanabe K, Aramaki H. Cannabidiolic acid-mediated selective down-regulation of c-fos in highly aggressive breast cancer MDA-MB-231 cells: possible involvement of its down-regulation in the abrogation of aggressiveness. J Nat Med (2016 Aug 16.) [Epub ahead of print].
- Dussy FE, Hamberg C, Luginbuhl M, Schwerzmann T, Briellmann TA. Isolation of ?9 -THCA-A from hemp and analytical aspects concerning the determination of ?9 -THC in cannabis products. Forensic Science International (2005) 149: 3–10.
- High Times Strongest Strains on Earth 2016. Accessed at: http://hightimes.com/strains/the-strongest-strains on-earth-2016/
- “Clinical Laboratory Improvement Amendments (CLIA).” - Centers for Medicare & Medicaid Services. N.p., n.d. Web. Accessed April 20, 2015.
- “CLIA-Compliant Analytical Method Validation Plan Template.” Association of Public Health Laboratories (APHL) Issues in Brief. December, 2013: 1-13. Web. Accessed April 20, 2015.
- Fischedick JT, Hazekamp A, Erkelens T, Choi YH, Verpoorte R. Metabolic fingerprinting of Cannabis sativa L., cannabinoids and terpenoids for chemotaxonomic and drug standardization purposes. Phytochemistry (2010) 71(17-18):2058-2073. doi:10.1016/j.phytochem.2010.10.001.
This article was written by 374 Labs and Quantum Analytics and edited by LabX.
Download the pdf of this application note.
About 374 Labs
374 Labs is a full service ISO/ICE 17025:2005 accredited laboratory developing cutting-edge methods and technologies to provide the most accurate and reliable analytical results.
374 Labs works with Cultivators, Producers and Laboratories to identify the most effective approach to industry challenges. Located in Sparks, Nevada, 374 Labs provides quality, cost-effective and convenient analytical testing and laboratory consulting services to address the state’s growing agricultural and marijuana testing industry. Together with their partners, they strive to produce sample data of the highest quality and integrity, ensuring the health and safety of consumers.
Quantum Analytics - Instrumental to your success in cannabis testing
We offer analytical instrumentation that covers a broad range of cannabis applications. Whether you are measuring potency or conducting terpene testing or screening pesticides, our product portfolio is designed to let you get your testing completed quickly and with confidence. We offer turn-key application support, cross platform system integration, installation, training & service for gas chromatography, liquid chromatography, mass spectrometry and near infrared spectroscopy.
Quantum Analytics works with you to simplify instrumentation acquisition. We specialize in understanding your unique analytical needs, and finding the right equipment and financing solution for you. We offer a rich portfolio of multi-vendor instrumentation, value-added services, and flexible financing options. Let us work with you to tailor the best solution to your unique testing needs.
Learn more:
www.LQA.com/cannabis
(650) 312-0900
LQA@LQA.com
Jan 09, 2026
Product News
BRANDTECH Scientific Introduces the Transferpette® pro Micropipette: A New Twist on Comfort and Control
The latest addition to its trusted line of precision liquid handling instruments, engineered for comfort, control, and repeatable accuracy.
Jan 06, 2026
Featured, Technical Insight
New Research Frontiers Unlocked by Next-Generation Flow Cytometry
Next-generation flow cytometry systems using acoustic focusing are opening entirely new areas of research that were previously impractical or inaccessible with conventional flow cytometers.
Jan 05, 2026
Buying Guides
The Bottom Line: How Smart Microcentrifuge Tube Choices Impact Lab Efficiency and Cost
Innovative microcentrifuge tube solutions are more than just lab consumables—they’re strategic tools that can reduce costs, improve outcomes, and support long-term sustainability goals.
Jan 05, 2026
Buying Guides
Future-Proofing Your Lab with Innovative Microcentrifuge Tube Solutions
As laboratories evolve to meet the growing demands of modern science, even the most basic tools—like microcentrifuge tubes—are being reimagined.
Jan 05, 2026
Buying Guides
Microcentrifuge Tube Innovations: Driving Sustainable Change
Integrating next-generation consumables into standard workflows can lead to a more sustainable and responsible research environment.
Jan 05, 2026
Buying Guides
Single Use Plastics: How to Manage these Major Contributors to Lab Waste
Reducing lab waste isn’t just a sustainability issue—it’s a financial and operational one, too.
Jan 05, 2026
Buying Guides
Common Microcentrifuge Tube Challenges in Sensitive Molecular Workflows
Key factors that can impact the performance of microcentrifuge tubes for PCR, qPCR, and NGS and other sensitive applications
Jan 05, 2026
Buying Guides
How to Research the Right Microcentrifuge Tubes for Your Application
Selecting the right microcentrifuge tubes starts with understanding the specific demands of your application.
Jan 05, 2026
Technical Insight
The Best Confocal Microscopes of 2026
Discover the best confocal microscopes of 2026 for advanced imaging. Compare top models from Zeiss, Evident, and Nikon for speed, resolution, and budget.

Dec 24, 2025
Featured, Popular Products, Technical Insight
Emerging Mass Spectrometry Technologies to Improve Intraoperative Diagnostics
Advances in mass spectrometry may soon reshape surgery, improving diagnostic accuracy and impacting post-operative outcomes