Gel Documentation: Best Practices for Nucleic Acid Imaging

Written By: Craig Bradley
Sep 26, 2025
GEMINI (2025) The precision of gel documentation is paramount for reliable nucleic acid imaging and subsequent data analysis. The visual representation of nucleic acids separated by electrophoresis serves as a critical checkpoint in molecular biology workflows, from gene expression studies to diagnostic assays. Ensuring the integrity and reproducibility of these images is not merely a matter of good practice; it is fundamental to the validity of scientific findings. This guide outlines the core principles and advanced techniques for optimizing gel documentation processes. The quality of a gel image is intrinsically linked to the meticulousness of the preparation steps that precede it. An optimized gel electrophoresis run is the first and most crucial determinant of a successful gel documentation outcome. The choice of gel matrix, buffer system, and electrophoresis conditions must be tailored to the specific nucleic acid fragment sizes under investigation. Overrunning a gel can lead to band smearing, while underrunning can result in poor resolution. Selecting the appropriate fluorescent dye is another critical consideration. While ethidium bromide ( Another key component is the DNA ladder or molecular weight marker. A well-defined ladder is essential for accurate fragment size estimation. It should be loaded consistently in the same lane for every gel to maintain a reliable point of reference. Proper loading technique, minimizing well-to-well variations in sample volume, also helps to ensure that quantification is not compromised by uneven band intensity. Finally, the gel itself must be uniform and free of bubbles or imperfections, which can create imaging artifacts. Once the gel has been prepared and run, the focus shifts to the hardware and software of the gel documentation system. The imager's configuration, including the light source, filters, and camera settings, directly impacts the quality of the final image. Most modern systems are equipped with both UV and blue light transilluminators, allowing flexibility for a range of fluorescent dyes. For UV-sensitive dyes like The camera, typically a scientific-grade CCD or sCMOS camera, is the heart of the system. The camera's settings—specifically exposure time, focus, and aperture—must be fine-tuned for each experiment. Exposure Time: This setting determines how long the camera sensor is exposed to light. A longer exposure time can capture weaker signals but also increases the risk of signal saturation. Conversely, a short exposure time may result in a dim or underexposed image. An iterative approach is often necessary to find the optimal balance. Focus: An out-of-focus image renders bands blurry and unusable for precise quantification. Most gel documentation systems have automated or manual focusing mechanisms to ensure sharp, high-resolution images. Aperture: The aperture setting controls the amount of light entering the camera. A wider aperture (lower f-stop number) allows more light in, which is useful for faint signals but may reduce the depth of field. A smaller aperture (higher f-stop number) increases the depth of field, which can be useful for gels that are slightly uneven. Choosing the correct emission filter is also vital. The filter is designed to block the excitation light and allow only the specific fluorescent emission from the dye to reach the camera sensor. Using the wrong filter can lead to a washed-out image with high background noise. For instance, a 520 nm filter is often used for dyes that emit green light, while a 605 nm filter is common for red-emitting dyes. Capturing a high-quality gel documentation image is only the first part of a successful analysis. To ensure the data is reliable, several key principles must be followed during the imaging and subsequent quantification process. A common pitfall is signal saturation, which occurs when the camera's sensor is overwhelmed by the fluorescence signal, causing bands to appear as solid white blobs with no discernible pixel intensity variation. This renders them useless for densitometric quantification. Image analysis software can often highlight saturated pixels, providing a visual warning to the user. To avoid this, a controlled exposure time and a lower dye concentration are essential. Many modern systems also feature a dynamic range indicator that can help prevent saturation. Quantification of bands is a primary reason for gel documentation. This process involves measuring the band intensity to determine the relative or absolute amount of nucleic acid. Accurate quantification relies on a linear relationship between the amount of DNA and the fluorescent signal intensity. This relationship is only valid within a specific range, so it is critical to ensure samples fall within this linear dynamic range. Background Subtraction: Before quantifying bands, the background signal must be subtracted. This removes noise and uneven illumination, providing a more accurate measure of the band's true intensity. Calibration Standards: For absolute quantification, a dilution series of a known standard (e.g., a DNA mass standard) is required. The measured band intensities of the unknown samples can then be compared to the standard curve to determine their exact concentration. Data Integrity: The raw, unedited image data should be stored alongside the processed image and quantification results. This provides a transparent record for validation and future reference. The ultimate goal of any laboratory process is reproducibility and reliability. For gel documentation, this is achieved through the development and strict adherence to standard operating procedures (SOPs). A well-defined SOP for gel imaging ensures that every experiment is performed under the same conditions, minimizing variability between different users or from one experiment to the next. An effective SOP should include the following components: SOP Component Description Pre-Imaging Checklist Details for preparing the gel, cleaning the transilluminator, and preparing the system for imaging. System Settings Specifies the exact camera settings (exposure, focus, aperture), filter selection, and light source to be used for specific dyes or experiments. Image Acquisition Step-by-step instructions for capturing the image, including guidelines for avoiding saturation and positioning the gel correctly on the transilluminator. Data Management Outlines where to save the raw image file, the naming convention for files, and the location for storing analysis results. Troubleshooting Provides solutions for common problems like faint bands, high background, or image artifacts. Maintaining a comprehensive log of all gel documentation runs, including gel images, a description of the experiment, and the analysis data, is also a critical component of data integrity. This documentation supports traceability and is vital for regulatory compliance and scientific audits. The use of a validated and secure data management system, such as a laboratory information management system (LIMS), can automate much of this process, ensuring that data is securely stored and easily accessible. A standardized workflow not only enhances the quality of research but also increases the efficiency and productivity of the laboratory. Adopting a systematic approach to gel documentation transforms a simple process into a cornerstone of robust molecular biology workflows. By prioritizing meticulous gel preparation, a well-configured imaging system, and standardized data handling, laboratories can achieve unparalleled accuracy and reproducibility. The commitment to these best practices for nucleic acid imaging ensures that every band, every signal, and every data point contributes to a foundation of verifiable and trustworthy scientific findings. What is the primary purpose of a gel documentation system?
A gel documentation system is designed to capture and analyze images of gels used in electrophoresis, primarily for the visualization and quantification of nucleic acids and proteins. Why is it important to use a DNA ladder in nucleic acid imaging?
A DNA ladder or molecular weight marker is essential for determining the size of the unknown nucleic acid fragments in your sample lanes by providing a series of bands with known sizes. How can signal saturation be avoided during gel documentation?
To avoid signal saturation, use a shorter exposure time, reduce the concentration of the fluorescent dye, and ensure the camera's dynamic range is not exceeded during image acquisition. What is the difference between UV and blue light transillumination?
UV transillumination is used for traditional dyes like 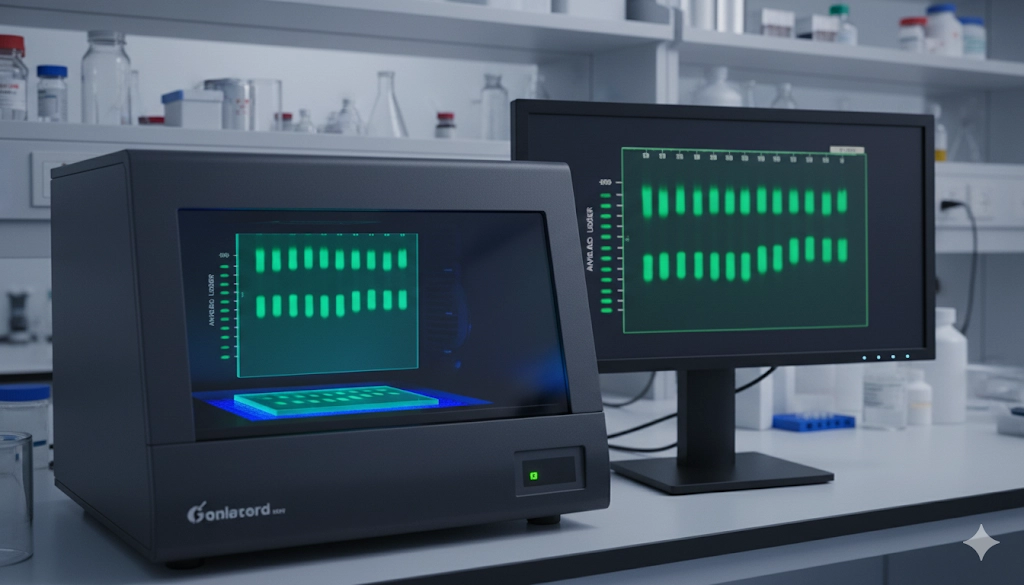
Foundational Gel and Sample Preparation for Optimal Gel Documentation
Configuring Your Gel Documentation System for Superior Imaging
Best Practices for Capturing and Quantifying Nucleic Acid Images
Standardizing Gel Documentation Workflows for Data Integrity
Elevating Your Lab's Gel Documentation Practices
FAQ: Common Gel Documentation Questions
Jan 09, 2026
Product News
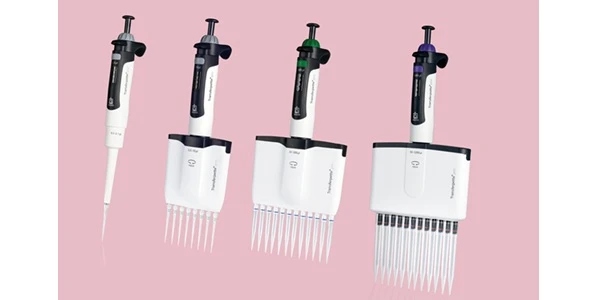
BRANDTECH Scientific Introduces the Transferpette® pro Micropipette: A New Twist on Comfort and Control
The latest addition to its trusted line of precision liquid handling instruments, engineered for comfort, control, and repeatable accuracy.
Jan 06, 2026
Featured, Technical Insight
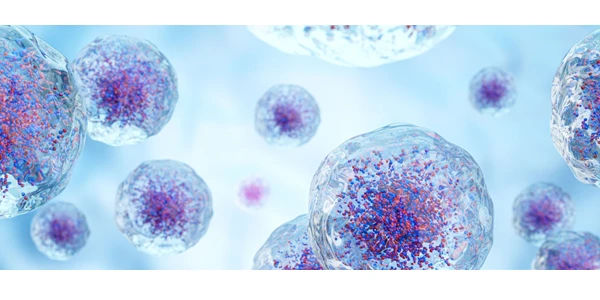
New Research Frontiers Unlocked by Next-Generation Flow Cytometry
Next-generation flow cytometry systems using acoustic focusing are opening entirely new areas of research that were previously impractical or inaccessible with conventional flow cytometers.
Jan 05, 2026
Buying Guides
The Bottom Line: How Smart Microcentrifuge Tube Choices Impact Lab Efficiency and Cost
Innovative microcentrifuge tube solutions are more than just lab consumables—they’re strategic tools that can reduce costs, improve outcomes, and support long-term sustainability goals.
Jan 05, 2026
Buying Guides
Future-Proofing Your Lab with Innovative Microcentrifuge Tube Solutions
As laboratories evolve to meet the growing demands of modern science, even the most basic tools—like microcentrifuge tubes—are being reimagined.
Jan 05, 2026
Buying Guides
Microcentrifuge Tube Innovations: Driving Sustainable Change
Integrating next-generation consumables into standard workflows can lead to a more sustainable and responsible research environment.
Jan 05, 2026
Buying Guides
Single Use Plastics: How to Manage these Major Contributors to Lab Waste
Reducing lab waste isn’t just a sustainability issue—it’s a financial and operational one, too.
Jan 05, 2026
Buying Guides
Common Microcentrifuge Tube Challenges in Sensitive Molecular Workflows
Key factors that can impact the performance of microcentrifuge tubes for PCR, qPCR, and NGS and other sensitive applications
Jan 05, 2026
Buying Guides
How to Research the Right Microcentrifuge Tubes for Your Application
Selecting the right microcentrifuge tubes starts with understanding the specific demands of your application.
Jan 05, 2026
Technical Insight
The Best Confocal Microscopes of 2026
Discover the best confocal microscopes of 2026 for advanced imaging. Compare top models from Zeiss, Evident, and Nikon for speed, resolution, and budget.

Dec 24, 2025
Featured, Popular Products, Technical Insight
Emerging Mass Spectrometry Technologies to Improve Intraoperative Diagnostics
Advances in mass spectrometry may soon reshape surgery, improving diagnostic accuracy and impacting post-operative outcomes